Introduction
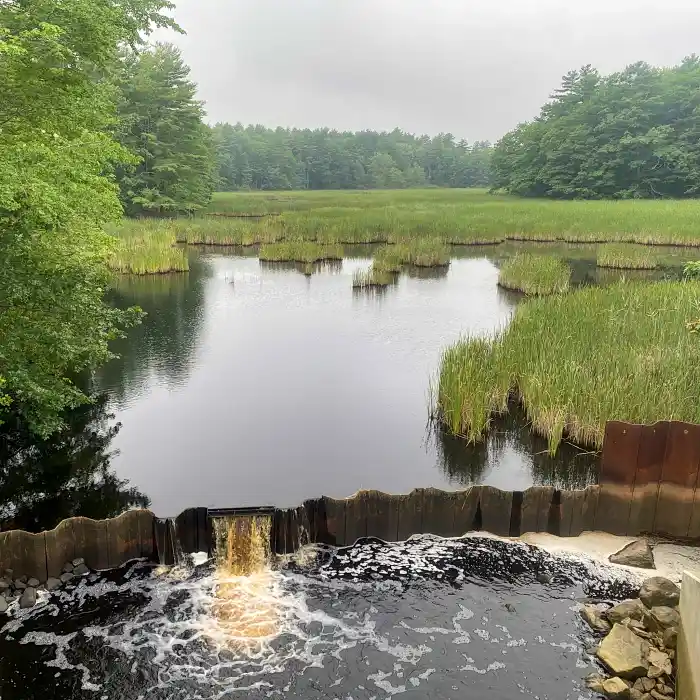
Healthy wetlands enhance our quality of life and provide many critical services and recreational opportunities. Wetlands are among the most productive ecosystems in the world, home to an immense variety of fish and wildlife. They trap pollutants, store carbon and buffer our shorelines from waves. To learn more about EPA activities to protect and restore these vital resources, visit the EPA wetlands page.
The National Wetland Condition Assessment is an EPA, state and Tribal partnership to assess the condition of wetlands across the United States (see acknowledgments for a list of partners). It is one of four statistical surveys in the National Aquatic Resource Surveys program. For more information, see the NARS history page.
The National Wetland Condition Assessment: The Third Collaborative Survey of Wetlands in the United States presents the results of the most recent survey of wetland conditions in the conterminous United States. Earlier surveys took place in 2011 and 2016. Originally, the EPA planned to complete the survey during the summer of 2021; however, COVID-19 pandemic delays caused some sampling to extend into 2022. For this report, sampling results from both years are referred to as NWCA 2021 results.
During the spring and summer of 2021 and 2022, 67 field crews sampled 1,060 wetland sites (both randomly selected and targeted), using standardized sampling procedures to collect data on biological, chemical, physical and human health indicators. The measured values were compared to NWCA benchmarks and the EPA’s recommended water quality criteria to assess wetland conditions.
The NWCA is designed to answer the following questions about wetlands across the United States:
- What percentage of wetlands support healthy ecosystems and recreation?
- What are the most common problems?
- Are conditions improving or getting worse?
The answers to these questions can help stakeholders plan for the protection and restoration of wetlands across the United States.
The NWCA design allows characterization of wetlands at national and regional scales. It is not intended to represent the condition of individual wetlands. The statistical design also accounts for the distribution of wetlands across the country, ensuring adequate representation of all regions, even in areas where there are few wetlands.
This report focuses on NWCA results at the national scale, comparing the condition of wetlands in 2021 to that from earlier surveys. The EPA also analyzed results at the regional level, for EPA regions and for five ecoregions. Noteworthy ecoregional results are highlighted for each indicator. Data included in the report were last updated in July 2024.
The NWCA can help us better understand the condition of wetlands and some of the stressors affecting them. While this report explores associations between biological indicators of wetland condition and stressors, additional research is needed to explain the causes of degraded conditions or identify sources of stressors. Future assessments will help determine whether changes observed between 2011 and 2021 represent a trend or reflect natural variability.
KEY FINDINGS ON 2021 CONDITION
The survey characterized wetlands using indicators of ecological condition and stress. Key results for 2021 are summarized below. Following standard practices (described in the background section), EPA analysts classified results for most indicators as good, fair or poor. The nonnative plant indicator had an additional condition category of very poor. For microcystins, a human health indicator, the EPA classified wetlands based on whether they exceeded the agency’s recommended recreational water quality criterion. Note that analyses of the soils data are still underway; this report will be updated when the results are available.
End of side note.Less than half of wetland area was rated good, based on an analysis of plant communities.
- The EPA calculated a vegetation indicator score by combining several metrics based on abundance and types of plant species into one value.
- The EPA found 45% of wetland area was in good condition.
Nonnative plants were a widespread concern.
- Using an indicator based on the occurrence and abundance of nonnative plants, the EPA found less than half of wetland area, 48%, was rated as being in good condition, and 24% was rated poor or very poor.
Physical alterations to wetlands were the most widespread stressors measured. The NWCA reports on six indicators of physical alteration, based on evidence of certain human activities at each site. These alterations directly affect vegetation, hydrology (water levels and the flow of water), or soil. The NWCA also measures the presence of multiple types of alterations at each site by combining the results of the six indicators.
- The combined indicator showed that 82% of wetland area was in fair or poor condition.
- Indicators for both vegetation replacement (for example, replacement of native vegetation with pasture or croplands) and vegetation removal (such as clearing or excessive grazing by livestock) showed 56% of wetland area was in fair or poor condition.
- The indicator for soil hardening (for example, soil compaction or hardened surfaces such as roads) showed fair or poor condition for 49% of wetland area.
Nutrient levels were elevated for some wetlands.
- Nitrogen and phosphorus levels were measured at wetland sites where enough surface water was present to collect a water sample. Nitrogen and phosphorus conditions were found to be poor at 17% and 24% of wetland area, respectively. However, because many wetlands did not have surface water, 40% of wetland area could not be assessed for water chemistry.
- In wetlands where phosphorus and nitrogen were elevated, biological condition expressed by the nonnative plant indicator was 1.6 and 1.7 times more likely, respectively, to be rated poor or very poor.
Microcystins, a type of cyanobacterial toxin, were present — but at very low levels — posing minimal recreational human health concerns.
- Microcystins were detected in 30% but exceeded the EPA’s recommended water quality criterion in less than 1% of wetland area. However, because many wetlands did not have surface water, 40% of wetland area could not be assessed for microcystins.
KEY FINDINGS ON CHANGE FROM 2016 TO 2021
For biological indicators (vegetation and nonnative plants), there was little change between surveys at the national level.
There were significant changes in some chemical and human health measures in 2021.
- Wetland area in good condition for nitrogen levels increased 8.4 percentage points, to 29%.
- Detection of microcystins increased by almost 22 percentage points, to 30%, but the small percentage of wetland area with concentrations that exceeded human health risk benchmarks (<1%) did not change significantly.
NWCA DASHBOARD
The EPA developed an interactive dashboard to accompany this report. It contains regional results and allows comparisons between NWCA wetland groups. The NWCA dashboard also provides wetland acreage for condition categories.
In addition to the link above, readers can access the dashboard by following the link at the bottom of each graph in this report, which will bring them to a customized page with regional data for each indicator. Dashboard users can then navigate to other views using the "Condition Estimates" dropdown and other dashboard controls.
HOW CAN I FIND OUT MORE?
Read the other sections of this report for more detail on the national results for each indicator, including data from 2011 and 2016 where available. Explore the interactive dashboard to compare conditions in different types of wetlands. See the NWCA 2021 Technical Support Document (U.S. EPA 2024) for technical details on the survey design and data analyses that underpin the findings in this report. Additional information about the NWCA and previous reports is available at the NWCA home page. The page is updated as new resources come out, so readers may want to visit periodically. Other NWCA information, such as published scientific research, is available at the NARS home page, along with NARS results for other surveys.
Background
A marsh in Adirondack Park, New York. Lydia Sweeney, New York Natural Heritage Program.
This section provides a brief background on the survey methodology. For additional details on survey design, field methods and quality assurance plans, see the EPA’s NARS manuals page. For further details on the NWCA survey design, see the EPA’s design documents page.
ABOUT WETLANDS
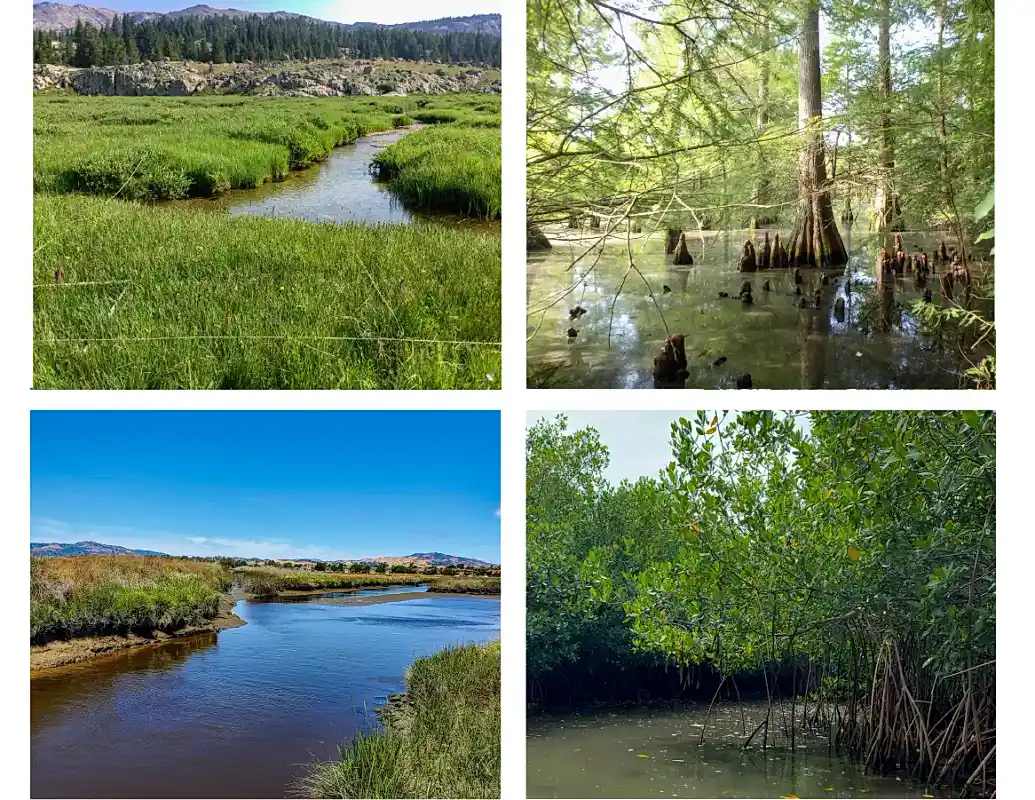
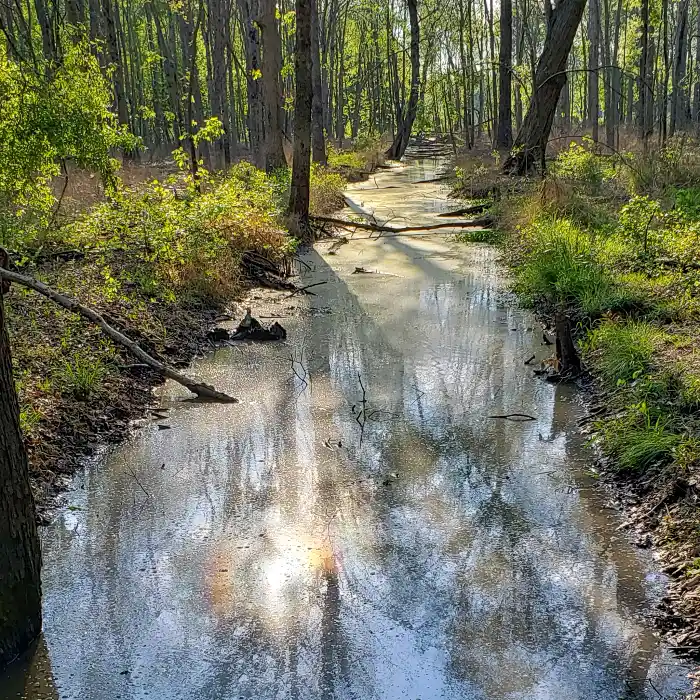
Wetlands are areas where water covers the soil or is present either at or near the surface of the soil all year or for varying periods of time during the year. For the NWCA, the EPA, states, Tribes and other partners surveyed many types of wetlands across the United States, including coastal salt marshes, mangrove swamps, inland marshes, seasonal wet prairie, bogs and forested wetlands. See the EPA’s wetland pages for a description of common wetland types.
CHOOSING INDICATORS
The EPA used 13 indicators to assess the biological, physical and chemical condition of wetlands. Indicators were chosen for their utility in reflecting ecological condition of wetlands or in indicating stress, which may influence condition. The EPA also considered indicators’ applicability across wetland types and environments and the ability of crews to collect the needed data during a one-day site visit (see the technical support document). The EPA also used one indicator to assess characteristics that pose risks to human health. Although there are others that could be used to describe wetland condition, the agency has determined these indicators align with the goals of the survey described earlier and are the most representative at a national scale. The EPA grouped indicators into four categories.
The survey included two biological indicators:
The EPA measured seven physical indicators. Six individual indicators measured physical alterations to vegetation, hydrology, and soil, and one combined results from all six:
- Vegetation removal | Vegetation replacement | Flow obstruction | Water addition or subtraction | Soil hardening | Surface modification | Physical alterations (sum).
There were three chemical indicators:
Lastly, the survey tracked one human health indicator:
SELECTING WETLANDS
The EPA used a statistical sampling approach to randomly select 933 of the wetland sites visited for this assessment. This set of sites was used to estimate the condition of the broader population of wetlands across the United States and ensure that survey results were unbiased. For more information on statistical surveys, see What Are Probability Surveys? and Selecting a Sampling Design. The target population for the NWCA was the set of wetlands in the conterminous United States meeting the definition below.
End of side note.Four Wetland Groups Used to Classify Wetlands for NWCA 2021
Clockwise, from the top left: an inland herbaceous site, Wyoming (Alannah Liebert, Colorado Natural Heritage Program); an inland woody site, Oklahoma (Oklahoma Conservation Commission); an estuarine woody site, Florida (Morgan Mack, Oak Ridge Institute for Science and Education); and an estuarine herbaceous site, California (Cara Clark, Moss Landing Marine Laboratories).
The 933 wetland sites mentioned above were identified using a statistical method called stratified random sampling. This approach is used in environmental, social science and health fields to more accurately assess subgroups within the larger population being studied. The NWCA 2021 stratified design randomly selected wetlands within several different categories, including ecoregion and wetland group. This method improves confidence in results associated with these subpopulations while maintaining robust and representative national results. See the design documentation and technical support document for more information.
The statistical design of the survey allows the EPA to extrapolate the results from the 933 wetland sites sampled to the 81,694,381 acres of wetlands meeting the criteria for the NWCA target population. Throughout this report, percentages reported for a given indicator apply to the 81,694,381 acres of wetlands in the target population. For example, if the condition is described as poor for 10% of wetlands nationally, this means that the area estimated to be degraded for that indicator is 8,169,438 wetland acres.
To produce the national results for each indicator, the EPA used established statistical approaches to assign each of the 933 sites a weight based on the total wetland area that the site represents. This enabled the EPA to estimate the proportion of wetland area in each condition category (for instance, good, fair or poor). See the technical support document for details.
When designing the survey, the EPA considered the number of wetland sites that should be sampled; a greater number of sites provides more confidence in the results. The 933 sites sampled in NWCA 2021 allow the EPA to determine the extent of wetlands in each condition category for each indicator within a margin of error of approximately ±5%, with 95% confidence at the national scale. See Exhibit 2 for a map of the 2021 sampling sites and their distribution across five ecoregions.
Map of NWCA 2021 Sampling Sites in Each Ecoregion

FIELD SAMPLING
Field crew member collecting a sample at a Virginia salt marsh. Virginia Institute of Marine Science.
To ensure consistency in collection procedures and to assure the quality of resulting data, field crews participated in training, used standardized field methods and followed strict quality control protocols (U.S. EPA 2021). Field and lab results were used to calculate scores for each indicator.
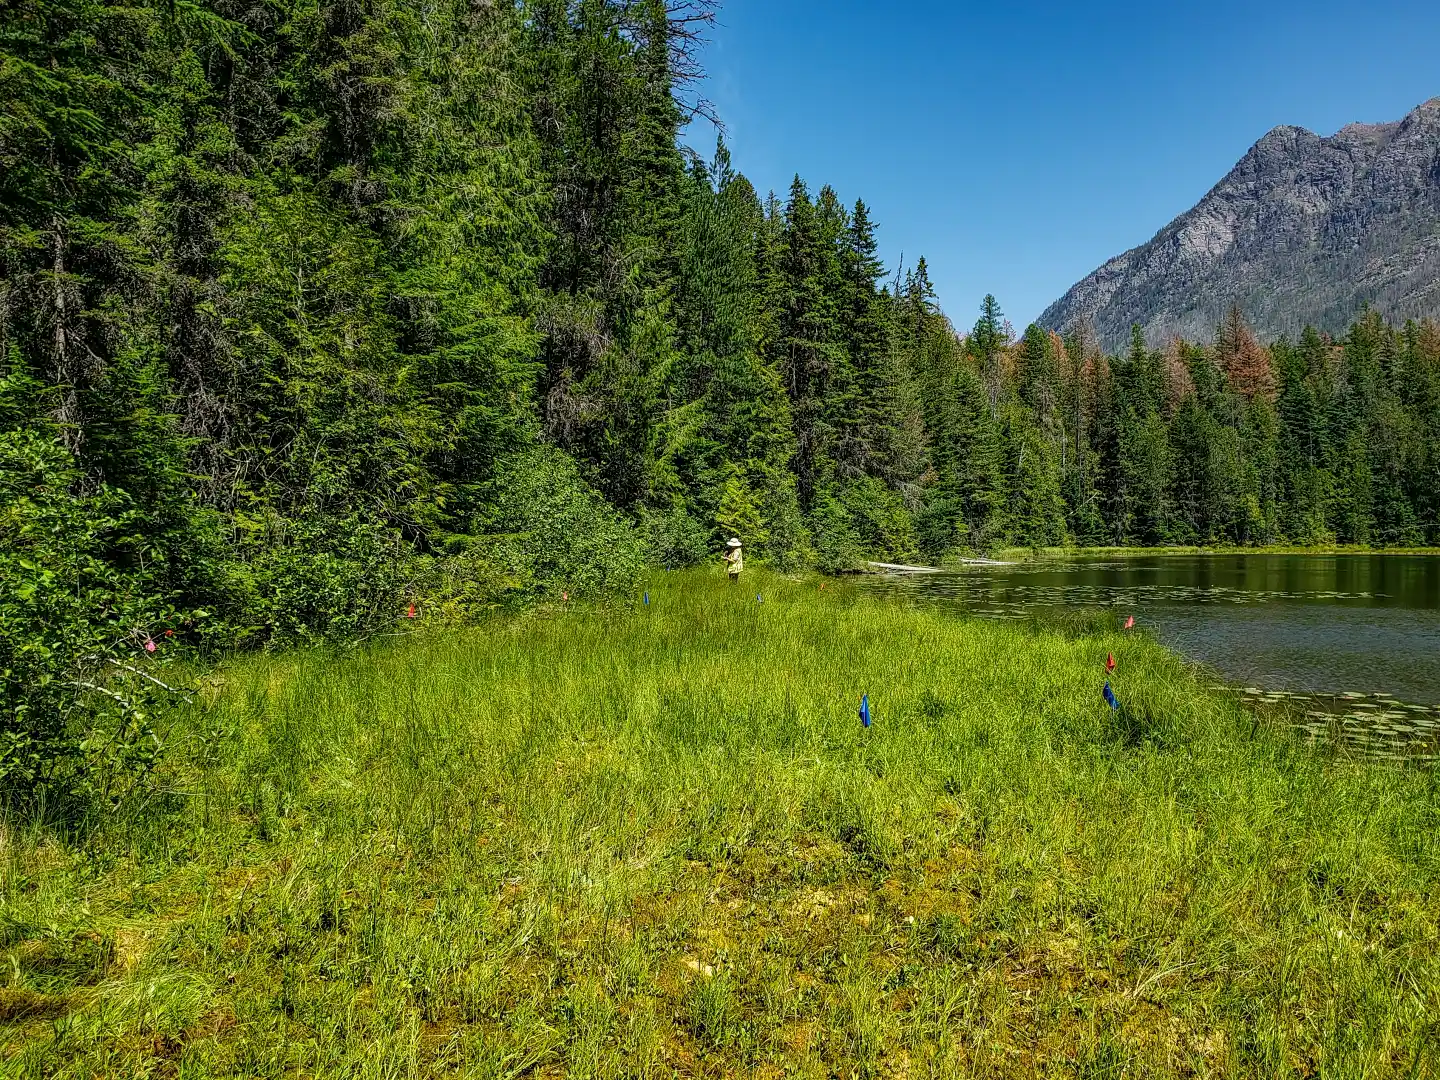
Field crews visited each wetland site once. They spent a full day collecting ecological data in a 0.5-hectare (1.24 acres) assessment area whose location was specified by the survey design documents. Crews collected additional data in a buffer area extending 100 meters from the assessment area edge (see Exhibit 3).
The crews collected data on vegetation, soils, hydrology and water chemistry from the assessment area. Crews also collected data on the presence of human-caused physical alterations observed in the assessment area and buffer.
Field crews used the standard layout shown in Exhibit 3 at most sites. Occasionally this layout was not possible because of the size and shape of the wetland at the specified location or because upland or deep water was present. In such cases, the NWCA protocols allowed alternate assessment area layouts.
NWCA 2021 Standard Assessment Area Layout

The black circle indicates the assessment area. Within that area, vegetation was documented inside five plots of 100 square meters each (yellow squares). Water sources feeding the wetland were noted and water quality samples taken where possible. At the southeast corner of the center-most vegetation plot (indicated by a black "X"), a soil pit was dug and soil chemistry samples were taken. In the buffer plots outside the assessment area (white squares) and in all of the assessment area, crews checked for nonnative vegetation and signs of human disturbance.
ASSESSMENT BENCHMARKS
NWCA analysts reviewed the raw data for each indicator. Based on each site’s data, they assigned a condition category to the site (for example, good, fair or poor) for each indicator. Thus, a site could be in good condition based on data for one indicator and poor condition based on another. To assign the appropriate condition category, the NWCA 2021 used two types of assessment benchmarks.
The first type consisted of fixed benchmarks based on values in the peer-reviewed scientific literature, values published by the EPA, or professional judgment by the scientists analyzing the data. For example, the EPA’s recommended water quality criterion was used nationally to classify wetlands as "above the criterion" or "at or below the criterion" for microcystins. Most fixed benchmarks did not change, but the physical alteration indicators were revised for NWCA 2021 as part of an adjustment of physical alteration assessment protocols. Please see the appendix for additional information.
The second type consisted of benchmarks based on the distribution of indicator values from a set of wetland reference sites. The EPA set benchmarks nationally, regionally or by wetland group, based on the indicators used or variations in indicator values. Such variations reflect differences in climate, geology, chemistry, ecology and human disturbance. See the results chapter of this report for more on how benchmarks were applied.
The steps below describe the EPA’s process for setting benchmarks based on these reference site distributions and then determining wetland conditions. Exhibits 4‑7 provide an example of how the benchmark for the vegetation indicator for estuarine herbaceous wetlands was derived.
The process for setting condition benchmarks for the other wetland groups and for chemical indicators was similar. The technical support document provides indicator-specific details (including details on screening for reference wetland sites). The EPA developed the reference-based benchmarks used in this report during earlier assessments.
1. Screen Wetlands to Identify Reference Sites. First, NWCA teams compiled wetland information from the 2011 and 2016 surveys for both the statistically selected sites and a smaller set of targeted sites thought to have low levels of human disturbance. EPA scientists evaluated these sites by considering reference screening factors such as physical alterations, soil heavy metals and nonnative plant cover. Wetlands that passed screening were considered less disturbed than others and were used in establishing the reference distribution (that is, the range of conditions observed at reference wetlands and used to set benchmarks). Exhibit 4 shows a map of estuarine herbaceous wetland reference sites. All were located in the Coastal Plains and Eastern Mountains/Upper Midwest ecoregions.
Estuarine Herbaceous Wetland Reference Sites

Each dot in Exhibit 5 indicates the observed vegetation score at one of the reference sites. Possible index values range from zero to 100, with higher values indicating better wetland condition. Many of the dots overlap because they have similar values.
Vegetation Index Values at Estuarine Herbaceous Reference Sites

2. Calculate Condition Benchmarks Using Reference Site Data. The EPA then used the 5th and 25th percentiles of the distribution of vegetation values observed at reference sites to set the benchmarks for the condition categories (see Exhibit 6).
Benchmarks for Condition, Based on Vegetation Index Values at Estuarine Herbaceous Reference Sites

3. Assign Condition Categories to Wetlands. Using those benchmarks, the EPA assigned the condition (good/fair/poor) to each of the estuarine herbaceous wetlands that were randomly sampled as part of the NWCA. Exhibit 7 shows the vegetation value for each estuarine herbaceous wetland site sampled in 2021 and the condition category in which it falls.
Vegetation Index Values at Estuarine Herbaceous Sites Randomly Sampled During NWCA 2021

The NWCA assessment benchmarks have no legal effect and are not equivalent to individual state water quality standards, nor do the condition categories correspond to the categories states and Tribes use when they assess the quality of wetlands relative to their specific water quality standards under the Clean Water Act. For example, a rating of poor condition in this report does not necessarily mean a site is "impaired" as defined by state and Tribal water quality standards assessment protocols. For additional information on state-specific and local water quality data and assessments, visit the EPA How’s My Waterway application. To learn more about water quality standards, visit the EPA Water Quality Standards Academy.
National Results
This chapter presents information on each of the NWCA indicators. Each indicator section contains three parts: a brief explanation of why the indicator matters, results from the 2021 survey and, in some cases, change in condition. All condition changes described in the text are statistically significant. For more details on the benchmarks for each indicator, see the NWCA 2021 Technical Support Document. To download raw data from the survey, visit the EPA NARS data page. All comparisons between earlier NWCA reports and NWCA 2021 should be made using the new information presented in the 2021 report and dashboard.
The graphs in this chapter show the estimated percentage of wetland area nationwide in each condition category (for example, good, fair and poor). Each graph also shows the percentage of wetland area that was not assessed. Exhibit 8 explains the graphical conventions used throughout this report to provide a point estimate and 95% confidence interval for each set of results displayed.
How To Read the Graphs in This Report

This image is an example of a graph showing the estimated percentage of wetland area in each condition category for the current survey. Similar conventions are used for graphs showing change between 2011 and 2021 and for graphs (in the next chapter) showing attributable risk associated with stressors. In all graphs, values shown are rounded to the nearest whole number. Readers may find that percentages across condition categories within a graph do not always total to 100%.
While this report focuses on national data, each graph in this chapter is accompanied by a customized link to the NWCA dashboard’s display of ecoregional data for the relevant indicator. For maps and characteristics of each ecoregion, visit the NARS ecoregions page.
BIOLOGICAL INDICATORS
Vegetation is a significant component of the biodiversity and structure of wetlands, and it provides habitat for microbes, insects, amphibians, reptiles, birds and mammals. The composition and abundance of plant species reflect and influence wetland hydrology, water chemistry and soil properties. Vegetation is a particularly good indicator of wetland condition because of its ability to respond to physical, chemical and biological disturbances at multiple temporal and spatial scales. The EPA used a vegetation indicator to evaluate wetland conditions as a whole and used a nonnative plant indicator to assess the impact of nonnative species on wetlands.
Vegetation
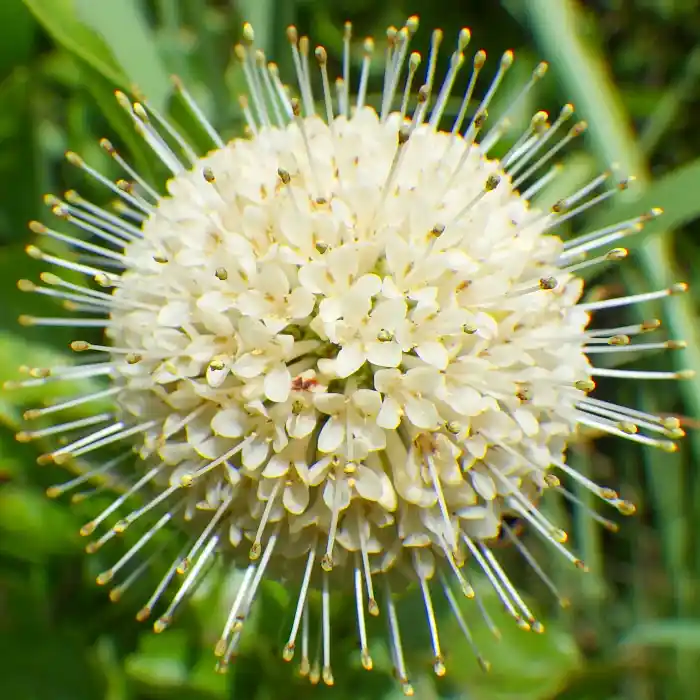
NWCA field crews measured area covered by native species such as this buttonbush (Cephalanthus occidentalis). Jenny Oakley, University of Houston-Clear Lake.
As mentioned above, the plant species at a site reflect climate and environmental conditions such as hydrology, soil properties and water chemistry. For example, plants such as cattails have special adaptations for getting oxygen to their roots, allowing them to grow in flooded soils, and salt marsh grasses have adaptations that limit salt uptake. Human-caused disturbances that alter ecosystem properties can result in degraded wetlands. Plant communities may respond to this degradation with changes in the abundance of individual species or plant groups (such as shrubs, grasses, or plants favoring wetter or drier conditions) or with the disappearance or addition of species to a site. This responsiveness makes vegetation a particularly good indicator of wetland condition.
Because wetlands are complex and vary so much nationally and even locally, a good way to compare them is to create an index. Rather than comparing sites for the presence of specific species, scientists use indexes that can take into account the number and abundance of species, the kinds of species and their sensitivity to disturbance. Such indexes can also be customized by wetland type and region.
A multimetric index combines multiple individual metrics into one index score to provide a holistic description of condition. The EPA developed four such indexes for vegetation, one for each NWCA wetland group (estuarine herbaceous, estuarine woody, inland herbaceous and inland woody). Each index evaluates four to six vegetation characteristics.
The characteristics measured for each index varied but had common elements. Every index, for instance, included metrics describing species’ tolerance to human disturbance.
End of side note.Every index measured key aspects of the health of native species, such as the area covered by native species, the number of native species, or the percentage of all species that were native. Several indexes also considered the prominence of certain types of plants, such as graminoids (grasses and grass-like plants) or monocots (which include graminoids, orchids, lilies, irises and others). The measures chosen for each of the wetland groups are described in the technical support document.
The EPA calculated benchmarks for good, fair and poor conditions for each index (see the assessment benchmarks section for a description of the benchmark development process). For three wetlands groups, benchmarks were set for the whole group, irrespective of location. For the inland woody wetlands group, the EPA developed two sets of benchmarks, one for sites in the Xeric and Interior Plains ecoregions and one for sites in the Eastern Mountains and Upper Midwest, Western Mountains, and Coastal Plains ecoregions. See the technical support document for details.
Almost one half of U.S. wetland area, 45%, was rated good based on vegetation, as shown below. The assessment also showed that 20% of wetland area was in fair condition, and 34% was in poor condition. Regionally, wetland conditions based on vegetation varied, but the Interior Plains, Western Mountains and Xeric ecoregions had the greatest percentages of area in poor condition, with 70%, 71% and 84%, respectively.
No statistically significant changes occurred nationally. However, a statistically significant decrease in area in good condition of 15 percentage points was observed for the Western Mountains subpopulation.
Nonnative Plants
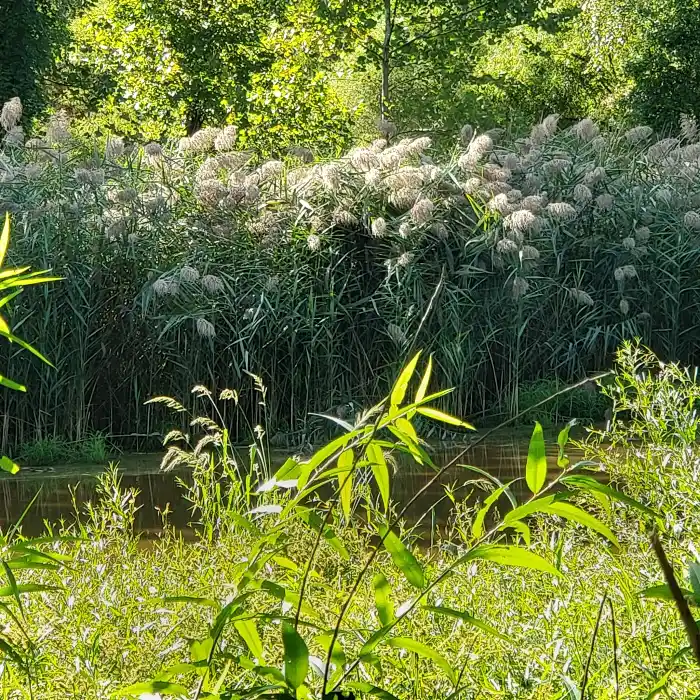
Common reed (Phragmites australis), visible in the background, is a nonnative grass that spreads rapidly and tolerates both fresh and brackish water. (A native subspecies of common reed also exists; it is usually found mixed with other plant species rather than in dense stands.) Natalie Auer.
Nonnative plants can directly and indirectly affect native vegetation and ecosystem components. Some nonnative plant species become invasive outside their regions of origin because they outcompete native species or change ecosystem properties. Even species native to one part of the United States can become invasive elsewhere. Saltmarsh cordgrass, for instance, is native to the East Coast but is invasive on the West Coast. Nonnative species that are not currently considered invasive may become so over time, and the presence of nonnative species indicates disturbed conditions and change from the expected plant community.
When native plants are outcompeted by nonnative plants, the insects, amphibians, birds and mammals that rely on native plants also face pressure, because nonnative vegetation often provides inferior habitat and food. In addition, changes driven by nonnative plants to vegetation structure or to the kinds of plants present can alter ecosystem services like flood reduction, carbon storage and water-quality enhancement.
The nonnative plant indicator includes three complementary metrics readily calculated from field observations. These metrics consider the percentage of area covered by nonnative species, the number of unique nonnative species, and the number of plots containing nonnatives (the frequency of nonnative species occurrence).
Wetlands were assessed as having good, fair, poor or very poor condition for this indicator based on whether the calculated value for each metric exceeded benchmark values established using best professional judgment. See the technical support document for details.
Condition based on the nonnative plant indicator was good in 48%, fair in 27%, poor in 13% and very poor in 11% of wetland area across the United States. Regionally, good condition ranged from 13% in the Interior Plains ecoregion to 67% in the Coastal Plains ecoregion.
No statistically significant changes occurred at the national level. Significant changes in condition did occur in three ecoregions. The Eastern Mountains and Upper Midwest ecoregion had a decrease in good condition of 17 percentage points. The Interior Plains had an increase in poor condition of 9 percentage points. The Xeric ecoregion had a decrease in very poor condition of 21 percentage points.
PHYSICAL INDICATORS
Modifying physical features of wetlands or the surrounding area may impair wetland function and diminish ecological conditions. Observations of these physical alterations can indicate the degree of disturbance to a wetland and, ultimately, its condition.
The physical alteration protocol and its associated indicators were revised for 2021 (see the appendix and technical support document for description of the differences). New fixed benchmarks were developed based on professional judgment by the scientists analyzing the data. The revision was substantial enough that previous survey data from 2011 and 2016 could not be used to analyze change. Therefore, no change data are shown below.
Field crews used checklists to document physical alterations. Alterations were observed across the assessment area and in 12 plots (100 square meters each) in the buffer area surrounding the assessment area.
Some physical alterations can occur naturally. For instance, beavers build dams that impede the flow of water into and out of wetlands, and native animals browse vegetation. In calculating physical alteration indicator scores, the EPA attempted to exclude naturally occurring alterations.
The NWCA physical indicators of stress included the presence of two types of vegetation alteration (removal or replacement), two types of hydrologic alterations (flow obstruction or water addition/subtraction), and two types of alterations affecting soil (surface modification or soil hardening). The EPA also developed a summary indicator, which combined scores for the other six indicators.
For each observed alteration, the EPA assigned points based on the extent or severity of the disturbance within the assessment area and the plot’s distance from the assessment area. A score of zero meant no alterations were observed, indicating good condition. A score at or above 25 indicated poor condition for the six individual indicators. A score at or above 50 indicated poor condition for the summary indicator.
Vegetation Removal
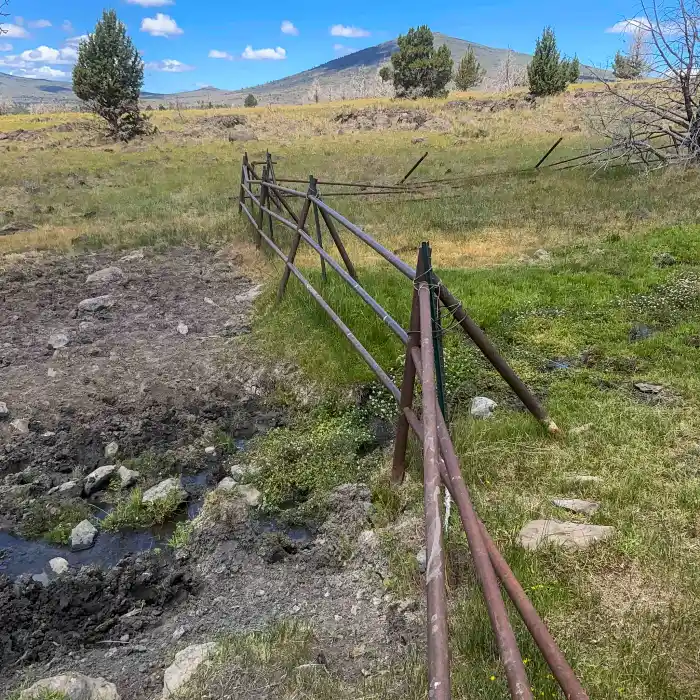
Part of the forest in this North Carolina wetland has been clear-cut. Skadi Kylander, North Carolina Department of Environmental Quality.
The vegetation removal indicator evaluates the loss, removal or damage of vegetation due to human activity. Examples of removal activities include logging, mowing, excessive grazing by livestock or feral animals (such as hogs or nutria), herbicide use, and fire. Removal of vegetation may increase sediment, nutrient and pollutant loads entering or collecting in a wetland.
Nationally, the vegetation removal stressor rating was good for 42%, fair for 31% and poor for 26% of wetland area. Another 2% of wetland area was not assessed because of missing data. The Xeric ecoregion had the largest proportion of wetland area rated poor, at 59%.
Vegetation Replacement
Lawn has replaced native forest in part of the wetland and wetland buffer at this Kentucky site. Michelle Cook, Kentucky Division of Water.
The vegetation replacement indicator reflects conversion of natural vegetation structure and composition due to human activity. Alterations could include conversion of natural plant communities to pasture, row crops, golf courses, lawns, parkland or nursery. Native plant species in rangeland could also be replaced by nonnatives, leading to changes in plant communities and native species richness, even if land use remains unchanged. Vegetation replacement can decrease biodiversity, simplify the vertical structure and reduce habitat quality on the site.
Nationally, the vegetation replacement stressor rating was good for 42%, fair for 23% and poor for 33% of wetland area. Another 2% of wetland area was not assessed due to missing data. The Xeric ecoregion had the largest proportion of wetland area rated poor, at 72%.
Flow Obstruction
This low dam prevents brackish tidal flow from entering this freshwater wetland most of the time. Scarborough, Maine. Doug Suitor, Maine Department of Environmental Protection.
The flow obstruction indicator reflects human activities that can impound water or impede its flow into, out of, or within the wetland (for instance, construction of dikes, dams, berms, or railroad beds). Such hydrologic alterations can affect vegetation, nutrients and habitat, thereby impacting the overall ecological condition of the wetland. For example, roadbed construction near coastal wetlands can cut off or reduce tidal flow, changing a marsh from saltwater to freshwater and eliminating daily fluctuation in water levels needed to support certain types of marsh vegetation.
Stress from flow obstructions was low overall. Condition was rated good in 74%, fair in 17% and poor in 7% of wetland area in the United States. The remaining 2% of wetland area was not assessed. The Xeric ecoregion had the largest proportion of wetland area rated poor, at 25%.
Water Addition or Subtraction
Ditches affect how water moves in and out of wetlands. Without this ditch, the water table would be higher. Natalie Auer.
The water addition or subtraction indicator reflects modifications that drain or add water to the site (for example, ditches, culverts, or stormwater outfalls). Some modifications, such as vehicle ruts that become stream channels, may be unintentional but are impactful nevertheless. Changes in how water moves into or out of a wetland can affect plant productivity, nutrient cycling in the soil and water, and the physical habitat, thereby impacting the overall ecological condition of the wetland. For example, ditches allow water to drain from the soil quickly and can lower the water table enough to dry out the soil surface.
The water addition or subtraction indicator showed good condition in 79%, fair in 15% and poor in 4% of wetland area across the United States. The remaining 2% of wetland area was not assessed. The Xeric ecoregion had the largest proportion of wetland area rated poor, at 22%.
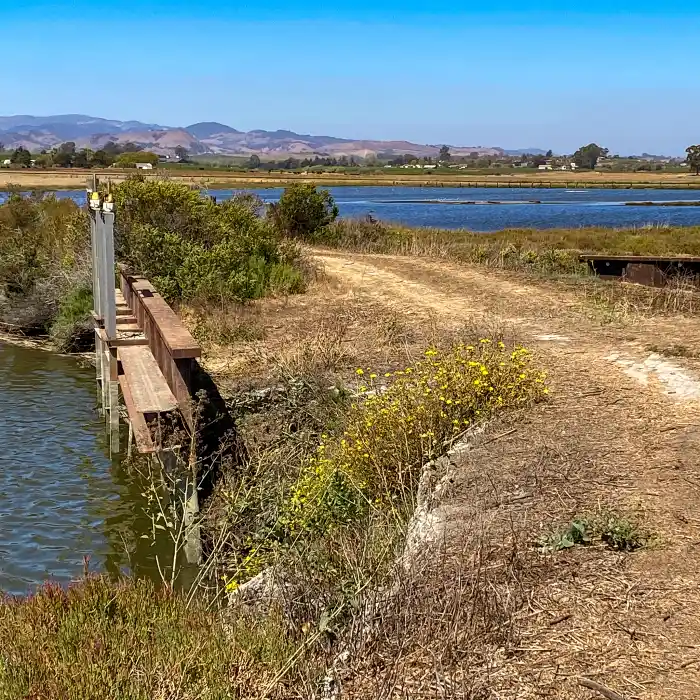
Soil Hardening
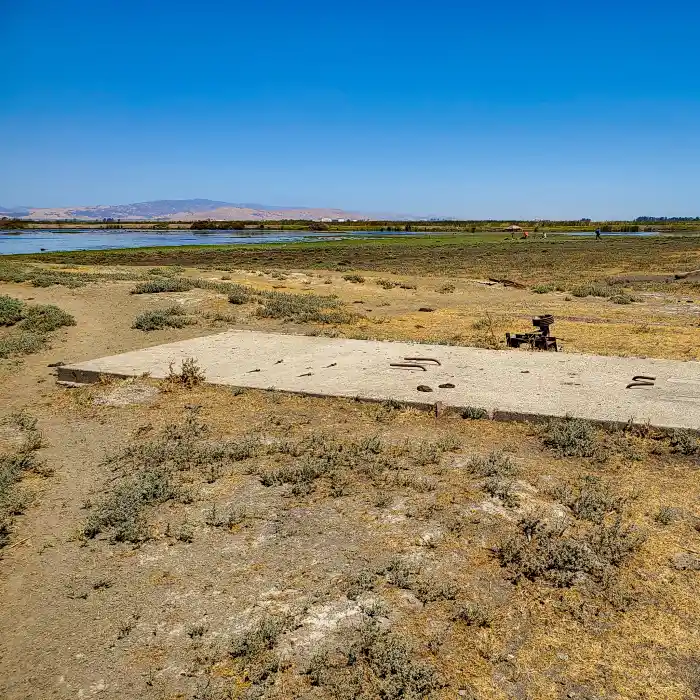
Impervious surfaces such as this concrete pad outside an NWCA site directly impact habitat, plant and soil integrity in wetlands. Cara Clark, Moss Landing Marine Laboratories.
The soil hardening indicator reflects activities and infrastructure that result in compaction of soil and the addition of impervious surfaces (for instance, parking lots, roads, buildings, or unpaved trails). Agriculture and vehicle use are examples of activities that can cause compaction. Soil compaction and impervious surfaces can directly impact wetland habitat, plants and soil integrity by hindering root growth and diminishing a wetland’s natural ability to filter and retain floodwaters.
The soil hardening indicator showed good condition in 49%, fair in 38% and poor in 12% of wetland area across the United States. The remaining 2% of wetland area was not assessed. The Xeric and Western Mountain ecoregions had the largest proportion of wetland area in poor condition, with 46% and 27%, respectively.
Surface Modification
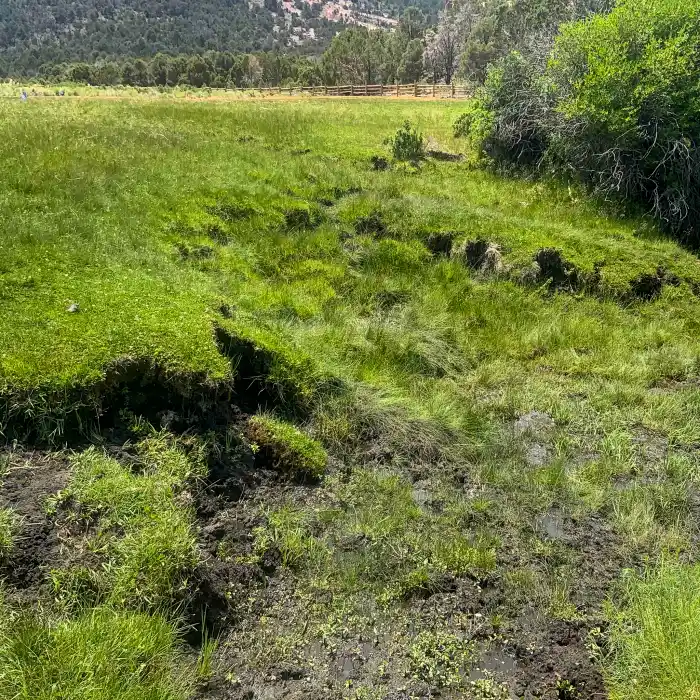
Evidence of erosion in a Utah meadow, as shown by the bare soil several inches lower than the grass surface. Wade Plafcan, PG Environmental.
The surface modification indicator reflects evidence of soil erosion or deposition. Examples include the following:
- Soil loss or exposure of plant roots.
- Excavation or dredging (removal of soil or sediment).
- Deposition of fill or spoil from elsewhere.
- Freshly deposited sediment carried by runoff.
Soil erosion within a wetland can result in wetland loss, while erosion outside a wetland may indicate that excess sediment is being deposited in the wetland. Filling can raise the wetland surface far enough above the water table that it is no longer a wetland. The soil or sediment deposited may also have a different physical and chemical composition than the native wetland soil, affecting the health and growth of native species.
The surface modification indicator showed good condition in 74%, fair in 18% and poor in 6% of wetland area across the United States. The remaining 2% of wetland area was not assessed. The Xeric ecoregion had the largest proportion of wetland area rated poor, at 12%.
Physical Alterations (Sum)
Multiple physical alterations in and around this wetland include filling and road construction (surface modification and soil hardening) and floodgate installation (flow obstruction), as well as vegetation replacement. Sarah Stoner-Duncan, Moss Landing Marine Laboratories.
In addition to looking at the six physical alterations separately, analysts also examined the combined impact by adding up the numeric scores across all indicators. This enabled the EPA to determine the extent to which wetlands were subject to multiple types of alterations and to estimate the combined effect on wetland conditions. The benchmarks for good condition remained the same as for individual physical alteration indicators, with zero (no observed alterations) indicating good condition. However, the benchmark for poor condition was raised to a score of at or above 50.
The combined physical alteration indicator showed good condition (low levels of physical stressors) in 17%, fair in 40% and poor in 42% of wetland area across the United States. The remaining 2% of wetland area was unassessed. Each of the physical alteration indicators included in the combined indicator showed good condition in 42% or more of wetland area. The finding that only 17% of area was in good condition for the combined indicator illustrates that many sites are subject to multiple physical alterations.
The Eastern Mountains and Upper Midwest had the largest area in good condition, at 24%. The Xeric ecoregion had the largest percentage of area in poor, at 84%.
CHEMICAL INDICATORS
Chemical stressors affecting wetland conditions include excess nutrients, metals, organic toxins and others. These stressors can disrupt nutrient cycles, affect plant and animal growth, and be detrimental to human health. Three chemical indicators of stress were developed for the NWCA using data from samples collected at each site: a soil heavy metal indicator and two water chemistry parameters (total nitrogen and total phosphorus). At some sites, collecting a soil sample was impossible because of ponded water or other site conditions on the sampling day. Water samples were only collected at sites where surface water was available.
Soil Heavy Metals
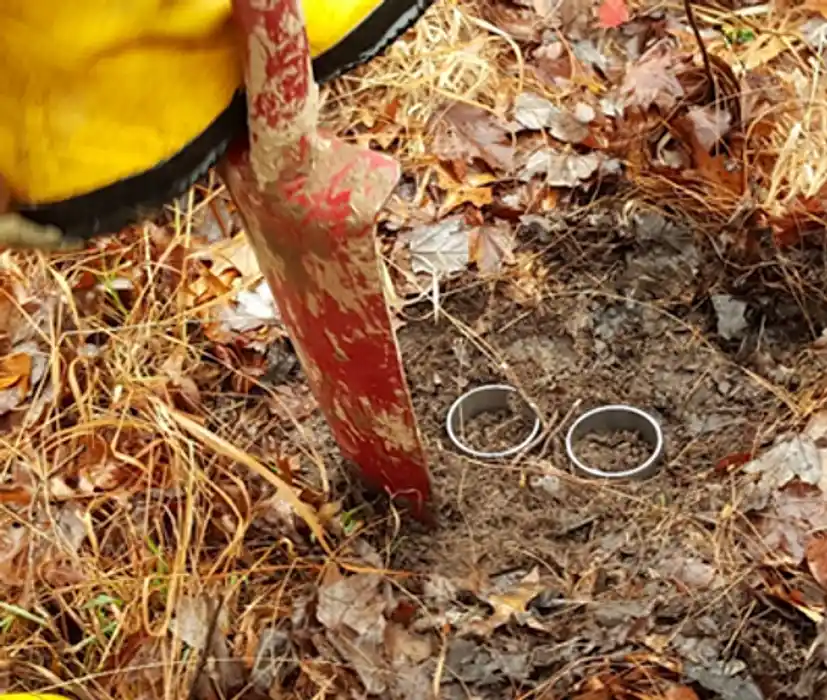
Sampling for soil chemistry. High metal concentrations in soil can affect vegetation growth. U.S. EPA.
For the soil heavy metals indicator, the EPA assessed concentrations of 12 different heavy metals closely associated with human activities: antimony, cadmium, chromium, cobalt, copper, lead, nickel, silver, tin, tungsten, vanadium and zinc. Benchmarks were established based on the extent to which regional background concentrations for each heavy metal were exceeded. Concentrations above these background levels are not very likely to occur naturally. The benchmarks established for this indicator do not reflect toxicity; rather, they are indicators of human disturbance. Sites were assigned ratings as follows:
- Good: No more than one of the 12 heavy metals had concentrations at least three times greater than the regional background level, and no single concentration exceeded five times the regional background level.
- Fair: Two heavy metals had concentrations at least three times the background level, or a single concentration was greater than five times but no greater than 10 times the background level.
- Poor: Three or more heavy metals had concentrations at least three times the background level, or any single concentration exceeded 10 times the background level.
Wetland heavy metal soil contamination can be due to runoff from roads, industrial discharges to air or water, mining operations, agriculture or illegal dumping.
Soil heavy metal results are not yet available from the laboratory. This section will be updated when results are ready.
Water Chemistry
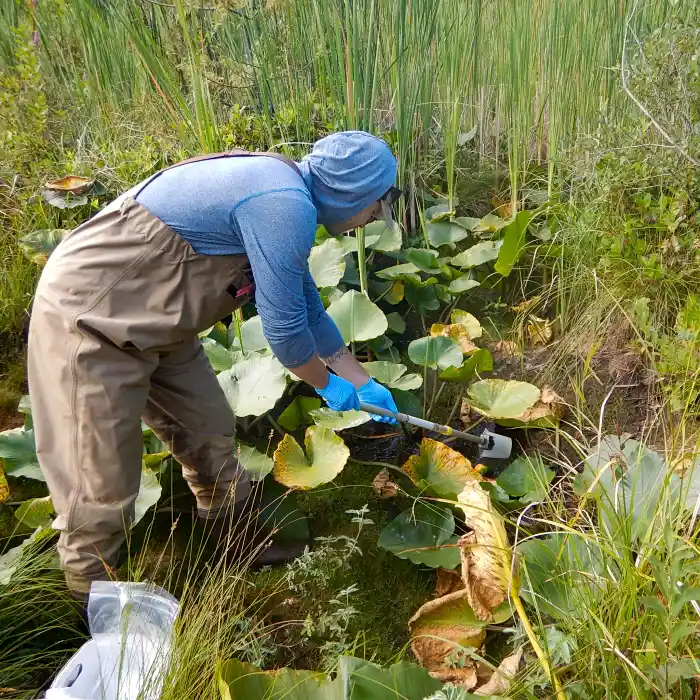
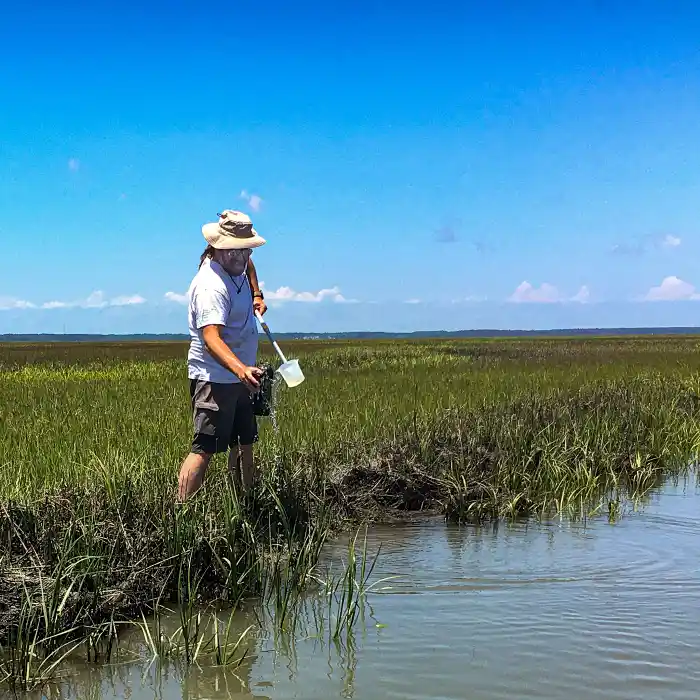
Collection of a water sample at Minkler Lake Conservation Area, Washington. Doug Gresham, Washington Department of Ecology.
Characterizing water chemistry is an integral part of aquatic resources assessment, because the physical and chemical properties of water directly reflect the surrounding environment, including human influences. However, wetlands differ from lakes, streams and coastal waters because surface water is not necessarily present. Furthermore, some wetland types, such as tidal wetlands and riverine wetlands, are more likely to have surface water at the time of sampling than other types, such as slopes and flats. Thus, the population of wetlands with surface water is not a random subset of the total wetland population surveyed in the NWCA (that is, the population of wetlands with surface water is biased towards wetlands that are characterized by continuous surface water). At sites with surface water, water samples were collected and analyzed for several water quality parameters. This section describes results for two indicators measured in the water column: total nitrogen and total phosphorus.
Some wetlands, such as marshes, have naturally high levels of nitrogen and phosphorus in their water due to contributions from surface water sources or decaying vegetation. Fens and bogs, on the other hand, have quite low levels since they get their water from direct rainfall and groundwater, which are naturally low in nutrients. Urban stormwater runoff, agricultural runoff, atmospheric deposition and septic systems are common sources of nutrients. Even wetlands with naturally high nutrient levels can be damaged by nutrient pollution, which can cause excessive plant and algae growth and may lead to changes in the abundance or occurrence of plant species at a site.
Since total nitrogen and total phosphorus are highly variable in wetlands, there are no national or regional literature-based benchmarks for these indicators. Thus, the EPA developed benchmarks for good, fair and poor conditions using an approach similar to the one described in the assessment benchmarks section. Separate benchmarks were developed for inland and estuarine wetland subpopulations. See the technical support document for specific details.
In 2021, 29% of wetland area was in good condition, 7% was in fair condition and 24% was rated poor for total phosphorus in water. Note that 40% of wetland area was not assessed due to insufficient surface water for sample collection. Regionally, the Interior Plains had the largest percentage in poor condition, 31%, and the Western Mountains had the largest percentage in good, 58%.
For more details, download the data for this chart, or visit the NLA dashboards for ecoregional data on water quality phosphorus.
In 2021, 29% of wetland area was in good condition, 14% was in fair condition and 17% was rated poor for total nitrogen in water. Note that 40% of wetland area was not assessed due to insufficient surface water. As with phosphorus, the Interior Plains had the largest percentage in poor condition, 25%, and the Western Mountains had the largest percentage in good, 61%.
For more details, download the data for this chart, or visit the NLA dashboards for ecoregional data on water quality nitrogen.
No statistically significant changes occurred at the national level for total phosphorus. Significant changes in condition did occur in three ecoregions. The Eastern Mountains and Upper Midwest ecoregion had an increase in good condition of 14 percentage points. The Western Mountains had a decrease in fair condition of 6 percentage points.
The percentage of wetland area that was not assessed was much lower in 2016 and 2021 than it was in 2011. Such large changes can affect change results for the other condition categories. As such, users are cautioned to consider the effect of the change in percentage of area not assessed when comparing 2011 results to those of later years.
A statistically significant increase in area in good condition, 8.4 percentage points, occurred nationally for total nitrogen. A statistically significant increase in area in good condition of 22 percentage points, along with a decrease in area in poor condition of 19 percentage points, was observed for the Eastern Mountains and Upper Midwest.
The percentage of wetland area not assessed was much lower in 2016 and 2021 than it was in 2011. Such large changes can affect change results for the other condition categories. As such, users are cautioned to consider the effect of the change in percentage of area not assessed when comparing 2011 results to those of later years.
HUMAN HEALTH INDICATOR
The NWCA examined one human health indicator, focusing on exposure to a group of toxins called microcystins. Exposure could occur while boating or through other contact with wetland waters. Because people do not generally swim in wetlands and many wetlands do not have fish large enough for human consumption, recreational exposure to human health risks is expected to be less in wetlands than in other waters. As a result, the NWCA does not analyze water for bacteria or fish tissue for chemical contaminants as other surveys in the NARS program do.
Microcystins
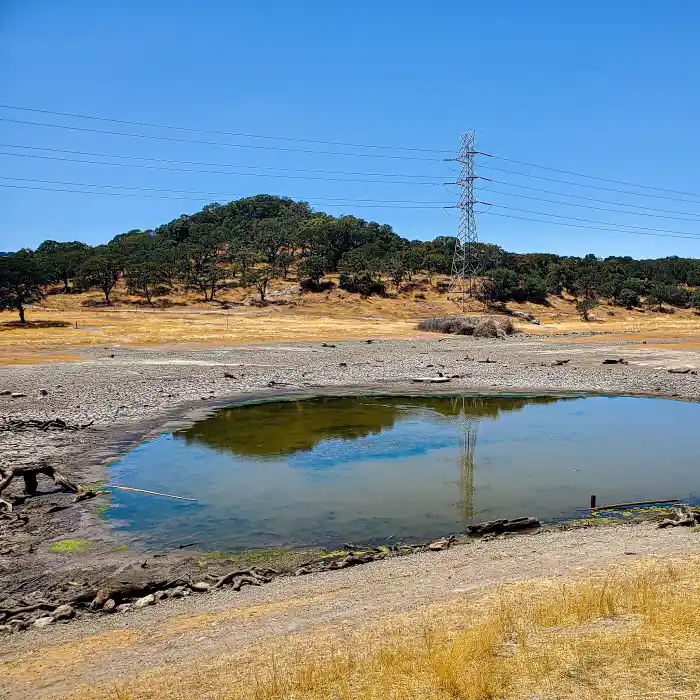
Remnants of a wetland pond containing cyanobacteria. Drought can increase water temperatures, facilitating cyanobacterial growth and toxin production. Cara Clark, Moss Landing Marine Laboratories.
Microcystins are toxins released by cyanobacteria, one-celled photosynthetic organisms that normally occur at low levels in surface waters. Under high-nutrient conditions, cyanobacteria can multiply rapidly, forming "blooms." Not all cyanobacterial blooms are toxic, but some may release microcystins, which could cause health effects. Recreational exposure is typically a result of inhalation, skin contact or accidental ingestion. See the EPA microcystins page for more information. Pets may also be exposed to microcystins if they swim in or drink wetland surface waters, although their risk levels may differ from those that apply to human health.
Microcystin results were compared to the EPA recreational water quality criterion and swimming advisory recommendation of 8 parts per billion (ppb) (U.S. EPA 2019).
The NWCA does not capture all risks associated with cyanobacteria. Note that some types of algae and cyanobacteria release other toxins not monitored as part of the NWCA. The NWCA assesses risk of exposure to microcystins at national and regional levels. For information about risks at specific locations, recreational water users should check with state, Tribal or local governments.
Nationally, levels exceeded the EPA’s recommended water quality criterion in less than 1% of wetland area, as shown below. A total of 40% of wetland area was not assessed due to insufficient surface water for sample collection. Microcystins were detected in 30% of wetland area in 2021, as shown in the dashboard. Regionally, the detection of microcystins ranged from 12% to 46%.
No statistically significant changes occurred at the national level.
The percentage of wetlands not assessed was much lower in 2016 and 2021 than it was in 2011. Such large changes can affect change results for the other condition categories. As such, users are cautioned to consider the effect of the change in percentage of area not assessed when comparing 2011 results to those of later years.
Associations Between Stressors and Wetland Condition
Vegetation removal, such as that caused by grazing, was a stressor likely to be associated with poor wetland condition. Wade Plafcan, PG Environmental.
Restoring wetland quality requires not only an understanding of current condition and change over time, but also of stressors associated with degraded wetland condition and the extent to which reducing those stressors could improve conditions. This knowledge can help decision makers prioritize stressors for reduction.
Stressors for the NWCA included most of the chemical and physical measures characterized by the indicators in the previous section. At the national and regional level, the EPA performed three calculations for each stressor, using the vegetation indicator as the biological indicator of wetland condition. The agency conducted a similar analysis using the nonnative plant indicator.
- The EPA determined the extent of wetland area in poor condition for each stressor (the relative extent).
- The EPA then evaluated the extent to which poor wetland condition was more likely when a stressor or indicator was rated poor (the relative risk).
- The EPA assessed the potential improvement that could be achieved by reducing or eliminating the stressor (the attributable risk).
The paragraphs below describe highlights of the relative extent, relative risk and attributable risk for the vegetation indicator. Visit the NWCA dashboards to further explore risk results at the national level and for selected survey subpopulations. For more information on these analyses, visit the NARS risk page.
The NWCA stressors with the highest relative extent nationally were the physical alteration sum indicator (42%), vegetation removal (26%) and phosphorus (24%). These were the most widespread stressors.
The physical alterations sum indicator and soil hardening had relative risks of 3.4 and 2.6, respectively. That is, wetlands with poor ratings for these stressors were about three times more likely to have poor condition based on the vegetation indicator than wetlands that were not poor for these stressors.
Combining the relative extent and relative risk values for each indicator into a single value provides us with attributable risk. Attributable risk estimates the percentage of wetland area for which biological condition could improve (that is, move into either the good or fair category) if the stressor were reduced (changed from poor condition to fair or good).
Calculating attributable risk involves several assumptions, including: 1) that a causal relationship between stressors and biological condition exists; 2) that poor wetland condition would be reversed if the stressor were improved to fair or good levels; and 3) that the stressor’s impact on a wetland’s condition is independent of other stressors. Despite these limitations, attributable risk can provide general guidance as to which stressors might be higher priorities for management nationally or regionally.
As shown in Exhibit 26, the EPA found that reducing the area in poor condition due to combined physical alterations in wetlands could result in the greatest benefit to wetland vegetation nationally. This exhibit shows attributable risk (including point estimates and 95% confidence intervals) for each stressor with risk values above zero. (Note that vegetation replacement was not included as a stressor in the risk graphs; see the technical support document for details.) If wetland area rated poor for the physical alterations sum indicator were improved to fair or good, the percentage of wetland area with poor vegetation condition could be reduced by 51%.
Attributable Risk from Exposure to Stressors Nationally (2021)
Reducing the extent and number of physical alterations in and around wetlands would have the greatest impact on wetland vegetation nationally. Many wetland plants are adapted to specific water levels, flow regimes and soils, and multiple habitat alterations can make it harder for such species to survive. Alterations also create openings for nonnative plants to establish themselves.
Using nonnative plants as another biological indicator of wetland condition, the EPA found that relationships between poor wetland condition and stressors were similar and, in some cases, more pronounced than between the vegetation indicator and stressors. The physical alterations sum indicator and water addition/subtraction indicator showed the highest relative risk, 4.3 and 2.8, respectively. That is, wetlands with poor ratings for these stressors were four and almost three times more likely to have a rating of poor condition based on the nonnative plant indicator.
The EPA calculated that reducing the occurrence of multiple physical alterations in wetlands could result in the greatest benefit to wetland condition nationally, based on the nonnative plant indicator, as shown in Exhibit 27. If poor condition for the physical alterations sum indicator were improved to fair or good, a 59% reduction in poor wetland condition could occur. For phosphorus and nitrogen, the reduction in poor condition could be 20% and 17%, respectively. Only risk values greater than zero are shown in the graph.
Attributable Risk from Exposure to Stressors Nationally (2021)
Some nonnative species are tolerant of a wide range of nutrient levels, allowing them to outcompete native species adapted to low nutrient levels. Reducing nutrient levels, particularly phosphorus, could reduce the amount of wetland area rated poor for the nonnative plant indicator.
To see graphs for relative extent, relative risk and attributable risk together, visit the "Risk Estimates" section of the NWCA dashboard.
Conclusion
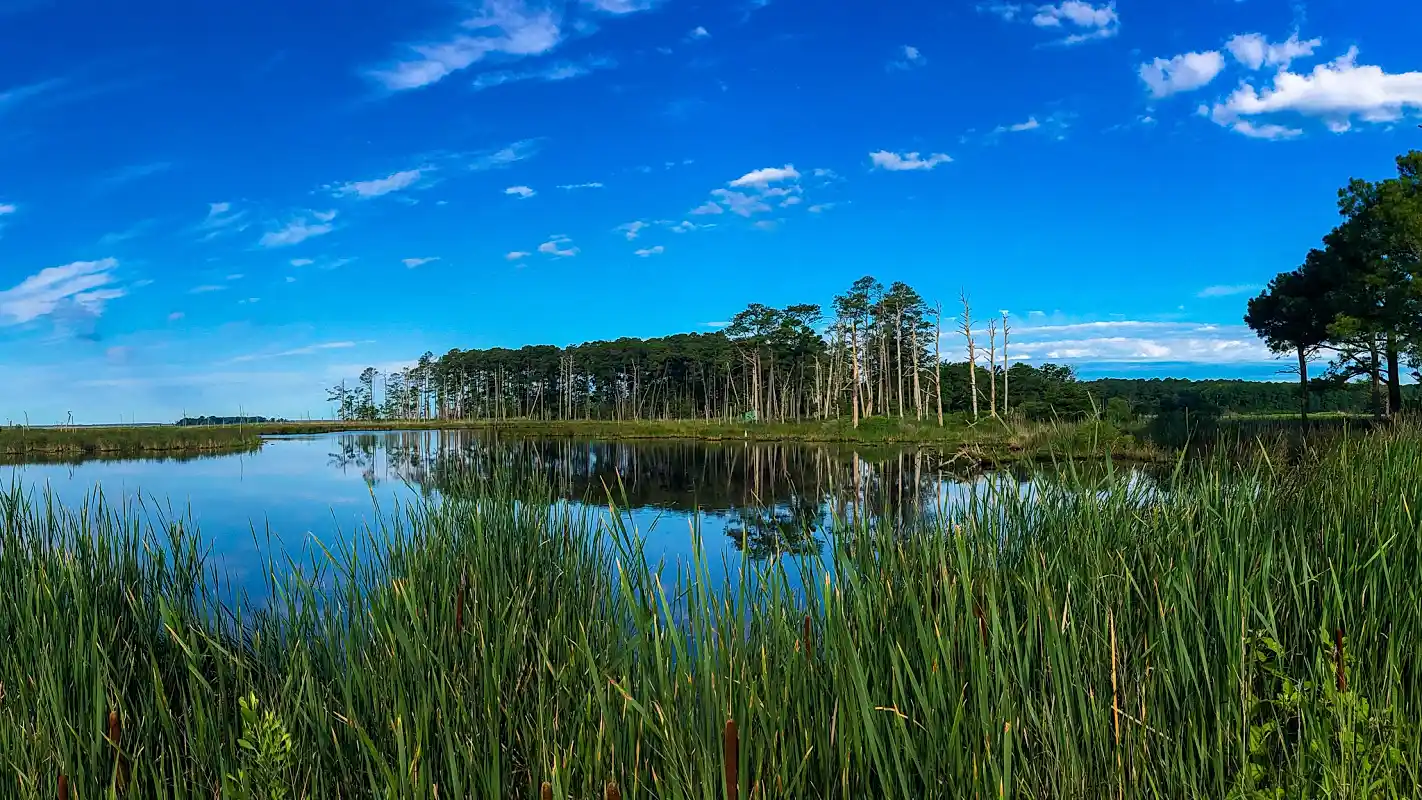
Blackwater National Wildlife Refuge, Maryland. Mike Crow.
The NWCA provides findings that wetland managers can use to inform resource management priorities and strategies. Nationally, 45% of wetland area was in good condition as measured by the vegetation indicator. Using the nonnative plant indicator, 48% of area was in good condition. The most widespread stressors were the combined physical alterations, vegetation replacement, vegetation removal, and phosphorus, rated poor in 42%, 33%, 26%, and 24% of wetland area, respectively. There was little change between surveys for the vegetation and nonnative plant indicators at the national level. There was a statistically significant change in nitrogen, with an 8.4 percentage point increase in area in good condition, and in the detection of microcystins, with a 22 percentage point increase in area where they were detected.
While the survey results provide national and regional estimates of wetland condition, they do not address all information needs at all scales. For example, the survey does not measure all stressors and cannot be used to infer local condition. In-depth monitoring and analysis of individual wetlands and watersheds are required to support local restoration and protection efforts.
The EPA and its state and Tribal partners are continually refining the NWCA and will apply lessons learned to determine the need for changes to the design, indicators, field methods, laboratory methods and analysis procedures for the future. Sampling for the fourth NWCA will take place in 2026.
NWCA 2021 would not have been possible without the involvement of state and Tribal scientists and resource managers. The EPA will continue to help state and Tribal partners translate the expertise gained through these national surveys to studies of their own waters. Additionally, the EPA will support the use of NWCA data to evaluate the success of efforts to protect and restore water quality.
End of side note.About This Report
This is the final version of the report, published in December 2024. Any corrections or updates to the final report will be described in this section.
A suggested citation for the report is provided below:
U.S. Environmental Protection Agency. 2024. National Wetland Condition Assessment: The third collaborative survey of wetlands in the United States. EPA 843-R-24-001. U.S. Environmental Protection Agency, Office of Water and Office of Research and Development. https://wetlandassessment.epa.gov/webreport
References
Dahl, T.E. 2006. Status and trends of wetlands in the conterminous United States 1998 to 2004. U.S. Department of the Interior, Fish and Wildlife Service. https://www.fws.gov/sites/default/files/documents/Status-and-Trends-of-Wetlands-in-the-Conterminous-United-States-1998-to-2004.pdf
U.S. Environmental Protection Agency. 2019. Recommended human health recreational ambient water quality criteria or swimming advisories for microcystins and cylindrospermopsin. EPA 822-R-19-001. U.S. Environmental Protection Agency, Office of Water, Health and Ecological Criteria Division. https://www.epa.gov/sites/production/files/2019-05/documents/hh-rec-criteria-habs-document-2019.pdf
U.S. Environmental Protection Agency. 2021. National Wetland Condition Assessment 2021: Field operations manual. V1.0. EPA-843-B-21-002. U.S. Environmental Protection Agency, Office of Water. https://www.epa.gov/national-aquatic-resource-surveys/national-wetland-condition-assessment-2021-field-operations
U.S. Environmental Protection Agency. 2024. National Wetland Condition Assessment 2021: Technical support document. EPA 843-B-24-003. U.S. Environmental Protection Agency, Office of Water and Office of Research and Development. https://www.epa.gov/national-aquatic-resource-surveys/national-wetland-condition-assessment-2021-technical-support
U.S. Fish and Wildlife Service. 2014. National Wetlands Inventory. U.S. Department of the Interior, Fish and Wildlife Service. https://www.fws.gov/program/national-wetlands-inventory
U.S. Fish and Wildlife Service. 2019. National Wetlands Inventory. U.S. Department of the Interior, Fish and Wildlife Service. https://www.fws.gov/program/national-wetlands-inventory. Data downloaded October 8, 2019.
Appendix: Changes to the NWCA Since 2016
Although many aspects of the survey remained the same in 2021, the EPA implemented some improvements for this iteration of the survey and report. This appendix describes changes since NWCA 2016. They include changes to the survey design, indicators, benchmarks and the way survey results are calculated.
SURVEY DESIGN
In 2016, the sample frame (the set of wetlands from which the survey sample was drawn) used elements of mapped wetland data from both the U.S. Fish and Wildlife Survey wetland status and trends survey (Dahl 2006) and the National Wetlands Inventory (U.S. FWS 2014). In 2021, the sample frame relied entirely on mapped wetland data from the National Wetlands Inventory (U.S. FWS 2019). This change aligned the sample frame with the current and full extent of mapped wetlands across the conterminous U.S., improving the spatial representation of wetlands included in the survey. In addition, the number of sites sampled in estuarine wetlands along the coasts was adjusted to ensure there were enough sites to report statistically robust results for the Pacific, Gulf and Florida, and Atlantic Coasts.
INDICATORS
The EPA updated field protocols and indicator score calculation for the physical alteration indicators between 2016 and 2021, as described below. The changes were substantive enough that it is not possible to calculate changes between surveys; thus, the EPA did not include estimates of change for these indicators in this report.
In 2016, crews recorded the presence of physical alterations in 12 plots, each 100 square meters, in the buffer area and at one plot of the same size at the center of the assessment area under a buffer assessment protocol. They also recorded hydrologic disturbances across the entire assessment area under a different protocol. In 2021, the protocols were consolidated, and crews assessed alterations from human disturbance in 12 buffer plots and across the entire assessment area. In the assessment area, crews noted not just the presence, but also the severity and extent of the disturbance.
The EPA updated how scores for physical alterations indicators are calculated in 2021. In 2016, the EPA categorized the disturbance data into six individual indicators and one cumulative indicator and calculated scores using a proximity-weighted scheme depending on where the disturbance was observed. In 2021, the disturbance data were categorized using the same individual and cumulative indicators, but the scoring was adjusted to also account for the severity and extent of disturbances observed in the assessment area. For details on these changes, see the technical support document.
BENCHMARKS
Additionally, the EPA updated benchmarks for the physical alteration indicators in 2021. The EPA adjusted the benchmarks for the indicator based on professional judgment by the scientists analyzing the data. For details on the updates, see the technical support document.
Acknowledgments and Disclaimer
The EPA Office of Water and EPA Office of Research and Development would like to thank the many people who contributed to this project. Without the collaborative efforts and support by state and Tribal environmental agencies, federal agencies, universities and other organizations, this assessment of wetlands would not have been possible. In addition, the survey could not have been done without the innumerable field biologists, soil scientists, taxonomists, statisticians and data analysts, as well as program administrators, EPA regional coordinators, project managers, quality control officers and reviewers. To the many hundreds of participants, the EPA expresses its profound thanks and gratitude.
State and Tribal Agency Partners
- Alabama Department of Environmental Management
- Arizona Department of Environmental Quality
- California State Water Resources Control Board
- Colorado Natural Heritage Program
- Confederated Tribes of the Colville Reservation
- Confederated Tribes of the Umatilla Indian Reservation
- Confederation of Northern Mariana Islands Bureau of Environmental and Coastal Quality
- Delaware Department of Natural Resources and Environmental Control
- District of Columbia Department of Energy and Environment
- Florida Department of Environmental Protection
- Georgia Department of Natural Resources, Environmental Protection Division
- Guam Environmental Protection Agency
- Idaho Department of Environmental Quality
- Illinois Environmental Protection Agency
- Illinois Natural History Survey
- Indiana Department of Environmental Management
- Iowa Department of Natural Resources
- Kansas Department of Health and the Environment
- Kansas Water Office
- Kentucky Division of Water
- Leech Lake Band of Ojibwe, Division of Resource Management
- Louisiana Department of Wildlife and Fisheries
- Maine Department of Environmental Protection
- Maine Natural Areas Program
- Maryland Department of the Environment
- Massachusetts Department of Environmental Protection
- Michigan Department of Environment, Great Lakes and Energy
- Minnesota Pollution Control Agency
- Missouri Department of Natural Resources
- Montana Natural Heritage Program
- Navajo Environmental Protection Agency
- Nebraska Game and Parks Commission
- Nevada Division of Environmental Protection
- New Hampshire Department of Environmental Services
- New Jersey Department of Environmental Protection
- New Mexico Environmental Department
- New Mexico Natural Heritage Program
- New York Natural Heritage Program
- North Carolina Department of Environmental Quality
- North Dakota Department of Environmental Quality
- Ohio Environmental Protection Agency
- Oklahoma Conservation Commission
- Oregon Department of Environmental Quality
- Oregon Division of State Lands
- Pennsylvania Department of Environmental Protection
- Quinault Indian Nation
- South Carolina Department of Health and Environment Control
- Tennessee Department of Conservation and Environment
- Texas Commission on Environmental Quality
- Utah Department of Environmental Quality
- Utah Geological Survey
- Vermont Department of Environmental Conservation
- Virginia Department of Environmental Quality
- Washington Department of Ecology
- Washington Natural Heritage Program
- West Virginia Department of Environmental Protection
- Wisconsin Department of Natural Resources
- Wisconsin State Laboratory of Hygiene
- Wyoming Department of Environmental Quality
Federal Partners
- National Park Service
- U.S. Army Corps of Engineers
- U.S. Department of Agriculture, Natural Resources Conservation Service
- U.S. EPA Office of Research and Development
- U.S. EPA Office of Water
- U.S. EPA Regions 1-10
- U.S. Fish and Wildlife Service
- U.S. Forest Service
- U.S. Geological Survey
Additional Collaborators
- Avanti
- Burke Museum Herbarium
- Coastal Environment
- Crow Insight
- Eastern Kentucky University
- EnviroScience
- ESS Group
- Four Peaks Environmental Science and Data Solutions
- General Dynamics Information Technology
- Great Lakes Environmental Center
- Midwest Biodiversity Institute
- Moss Landing Marine Laboratories
- New England Interstate Water Pollution Control Commission
- North Dakota State University
- Oregon State University
- PG Environmental
- Riparia at Pennsylvania State University
- Southern California Coastal Water Research Project
- University of Central Missouri
- University of Florida
- University of Houston-Clear Lake
- University of Illinois
- University of Montana
- University of New Mexico
- University of Wyoming
- Virginia Institute of Marine Sciences
Disclaimer. This report provides information on the quality of the nation’s wetlands. It does not impose legally binding requirements on the EPA, states, Tribes, other regulatory authorities or the regulated community. This document does not confer legal rights or impose legal obligations upon any member of the public. This document does not constitute a regulation, nor does it change or substitute for any Clean Water Act provision or EPA regulation. The EPA could update this document as new information becomes available. The EPA and its employees do not endorse any products, services or enterprises. Mention of trade names or commercial products in this document does not constitute an endorsement or recommendation for use.